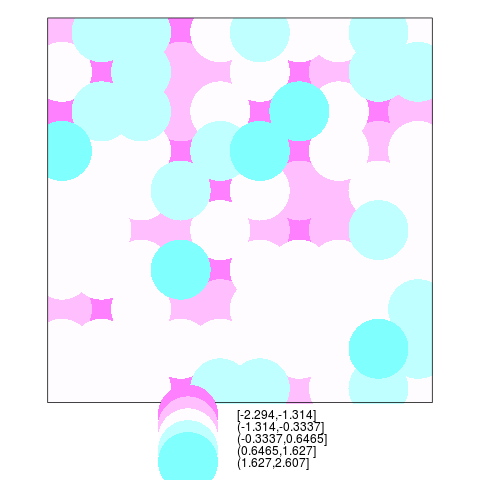
library(sp)
xyz = data.frame(expand.grid(x=1:10,y=1:10),rnorm(100))
coordinates(xyz)=~x+y
spplot(xyz, cex=10)
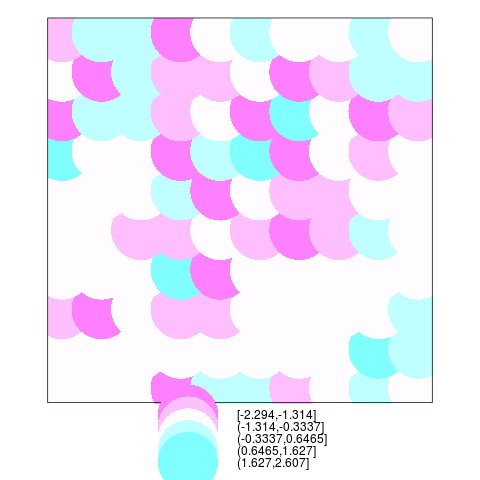
and with sp 0.9-97 and later in: